
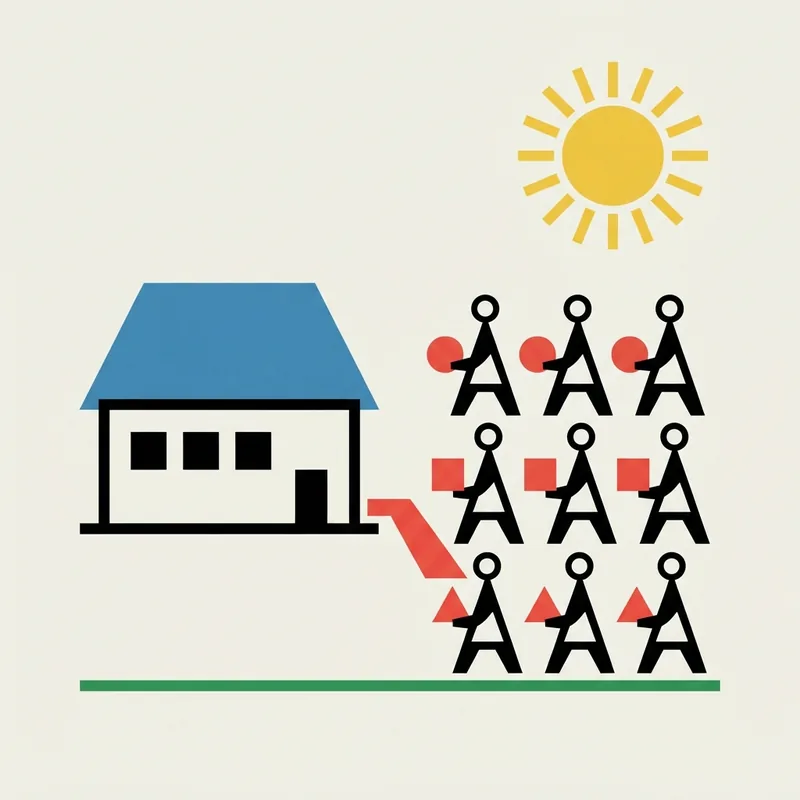
A picture language of standardized, abstracted symbols used to chart social and economic data, where quantity is shown by repeating identical figures rather than enlarging one.
Key traits
- Geometric
- Ordered
- Illustration-led
Palette
- #1f4e79
- #e8b23a
- #f2efe6
Origins
Isotype grew out of the Vienna Method of Pictorial Statistics, developed between 1925 and 1934 at the Social and Economic Museum of Vienna. Otto Neurath, the museum's founding director, was its initiator and chief theorist, working under the municipal social democratic government known as Red Vienna. Gerd Arntz, invited after Neurath saw his woodcut prints, moved to Vienna in 1929 and drew the graphics. Marie Reidemeister turned source data into chart sketches. The name Isotype was applied around 1935, after the practitioners left Vienna amid rising Austrian fascism.
Visual language
The defining move is serial repetition: a fixed value is shown as one small, identical, same-sized pictogram, and larger totals appear as more of those figures, never as a scaled-up one. Figures are flat, frontal, and almost never in perspective, keeping comparisons countable and clear. Simplified silhouettes of people, tools, and objects sit on plain grounds with ordered rows and columns, guided by rules for configuration and colour. Lettering is secondary, since charts are always paired with verbal labels and captions.
Palette and type
Limited, functional colour separates categories and keeps figures legible, with flat fills rather than shading or gradients. Type is plain and subordinate, used for titles, counts, and keys rather than display. The chart, not the letterform, carries the message.
What it signals
The style reads as civic, educational, and rational: it promises that statistics can be made attractive and memorable for ordinary citizens, including schoolchildren. It signals clarity, fairness of comparison, and public information rather than persuasion or decoration.
Where it works
Well suited to infographics, reports, museum displays, transit and wayfinding signage, and public data storytelling where counts matter. It works poorly for expressive or emotive subjects, and repetition can feel cold or crowded when charts are overloaded.
Related styles
Sources
- Isotype (picture language), Wikipedia accessed 2026-10-22
- Aesthetic Visual Index, Aesthetics Wiki accessed 2026-10-22